- OncoPaD assists in the rational design of cancer NGS panels based on mutational data of 7298 samples from 28 cancer types.
- OncoPaD helps design pan-cancer (28 tumor types), multi-cancer (e.g. hematological malignancies) panels, or cancer type-specific (e.g. breast cancer) panel .
- OncoPaD helps design cost-effective panels by maximizing the sample coverage , i.e. number of samples with mutations in genes of the panel, and minimizing the amount of DNA to sequence (considering gene fragments rather than whole genes).
- Panel results are displayed in user-friendly reports with ancillary information of the gene/gene regions included (e.g. if they are associated to biomarkers of drug response)
- OncoPaD panels may be used (see case studies) for cancer early detection, cancer stratification (i.e. group tumors by oncogenic mutations) or drug profiling (i.e. detect tumors with mutations that affect drug response).
Read more about ...
Researchers can design a pan-cancer (28 tumor types, both hematological and solid), multi-cancer (e.g. haematologic malignancies, or lung carcinomas) or cancer type specific (e.g. a breast carcinomas) panels. We compiled a list of cancer-type specific driver genes (N=576) from the following sources:
- Tumor type-specific driver genes included in the Cancer Drivers Database (2014.12) introduced by Rubio-Perez and Tamborero et al. (2015).
- Genes in the Cancer Gene Census (Futreal et al., 2004) with experimental evidence of involvement in tumorigenesis in any of the 28 cancer types of the pan-cancer cohort included in OncoPaD.
- Genes with experimentally validated oncogenic mutations meaningful for tumorigenesis in a specific cancer type; (see mutation annotation resources for more information).
- Driver genes of chronic lymphocytic leukemia (CLL) identified by Puente et al. (2015) based on mutation recurrence.
If researchers design a panel for drug effect biomarker genes, previously compiled driver genes are filtered for those whose alterations have been associated to drug response or resistance. Cancer types where genes were considered drivers were expanded with those where a drug effect was observed.
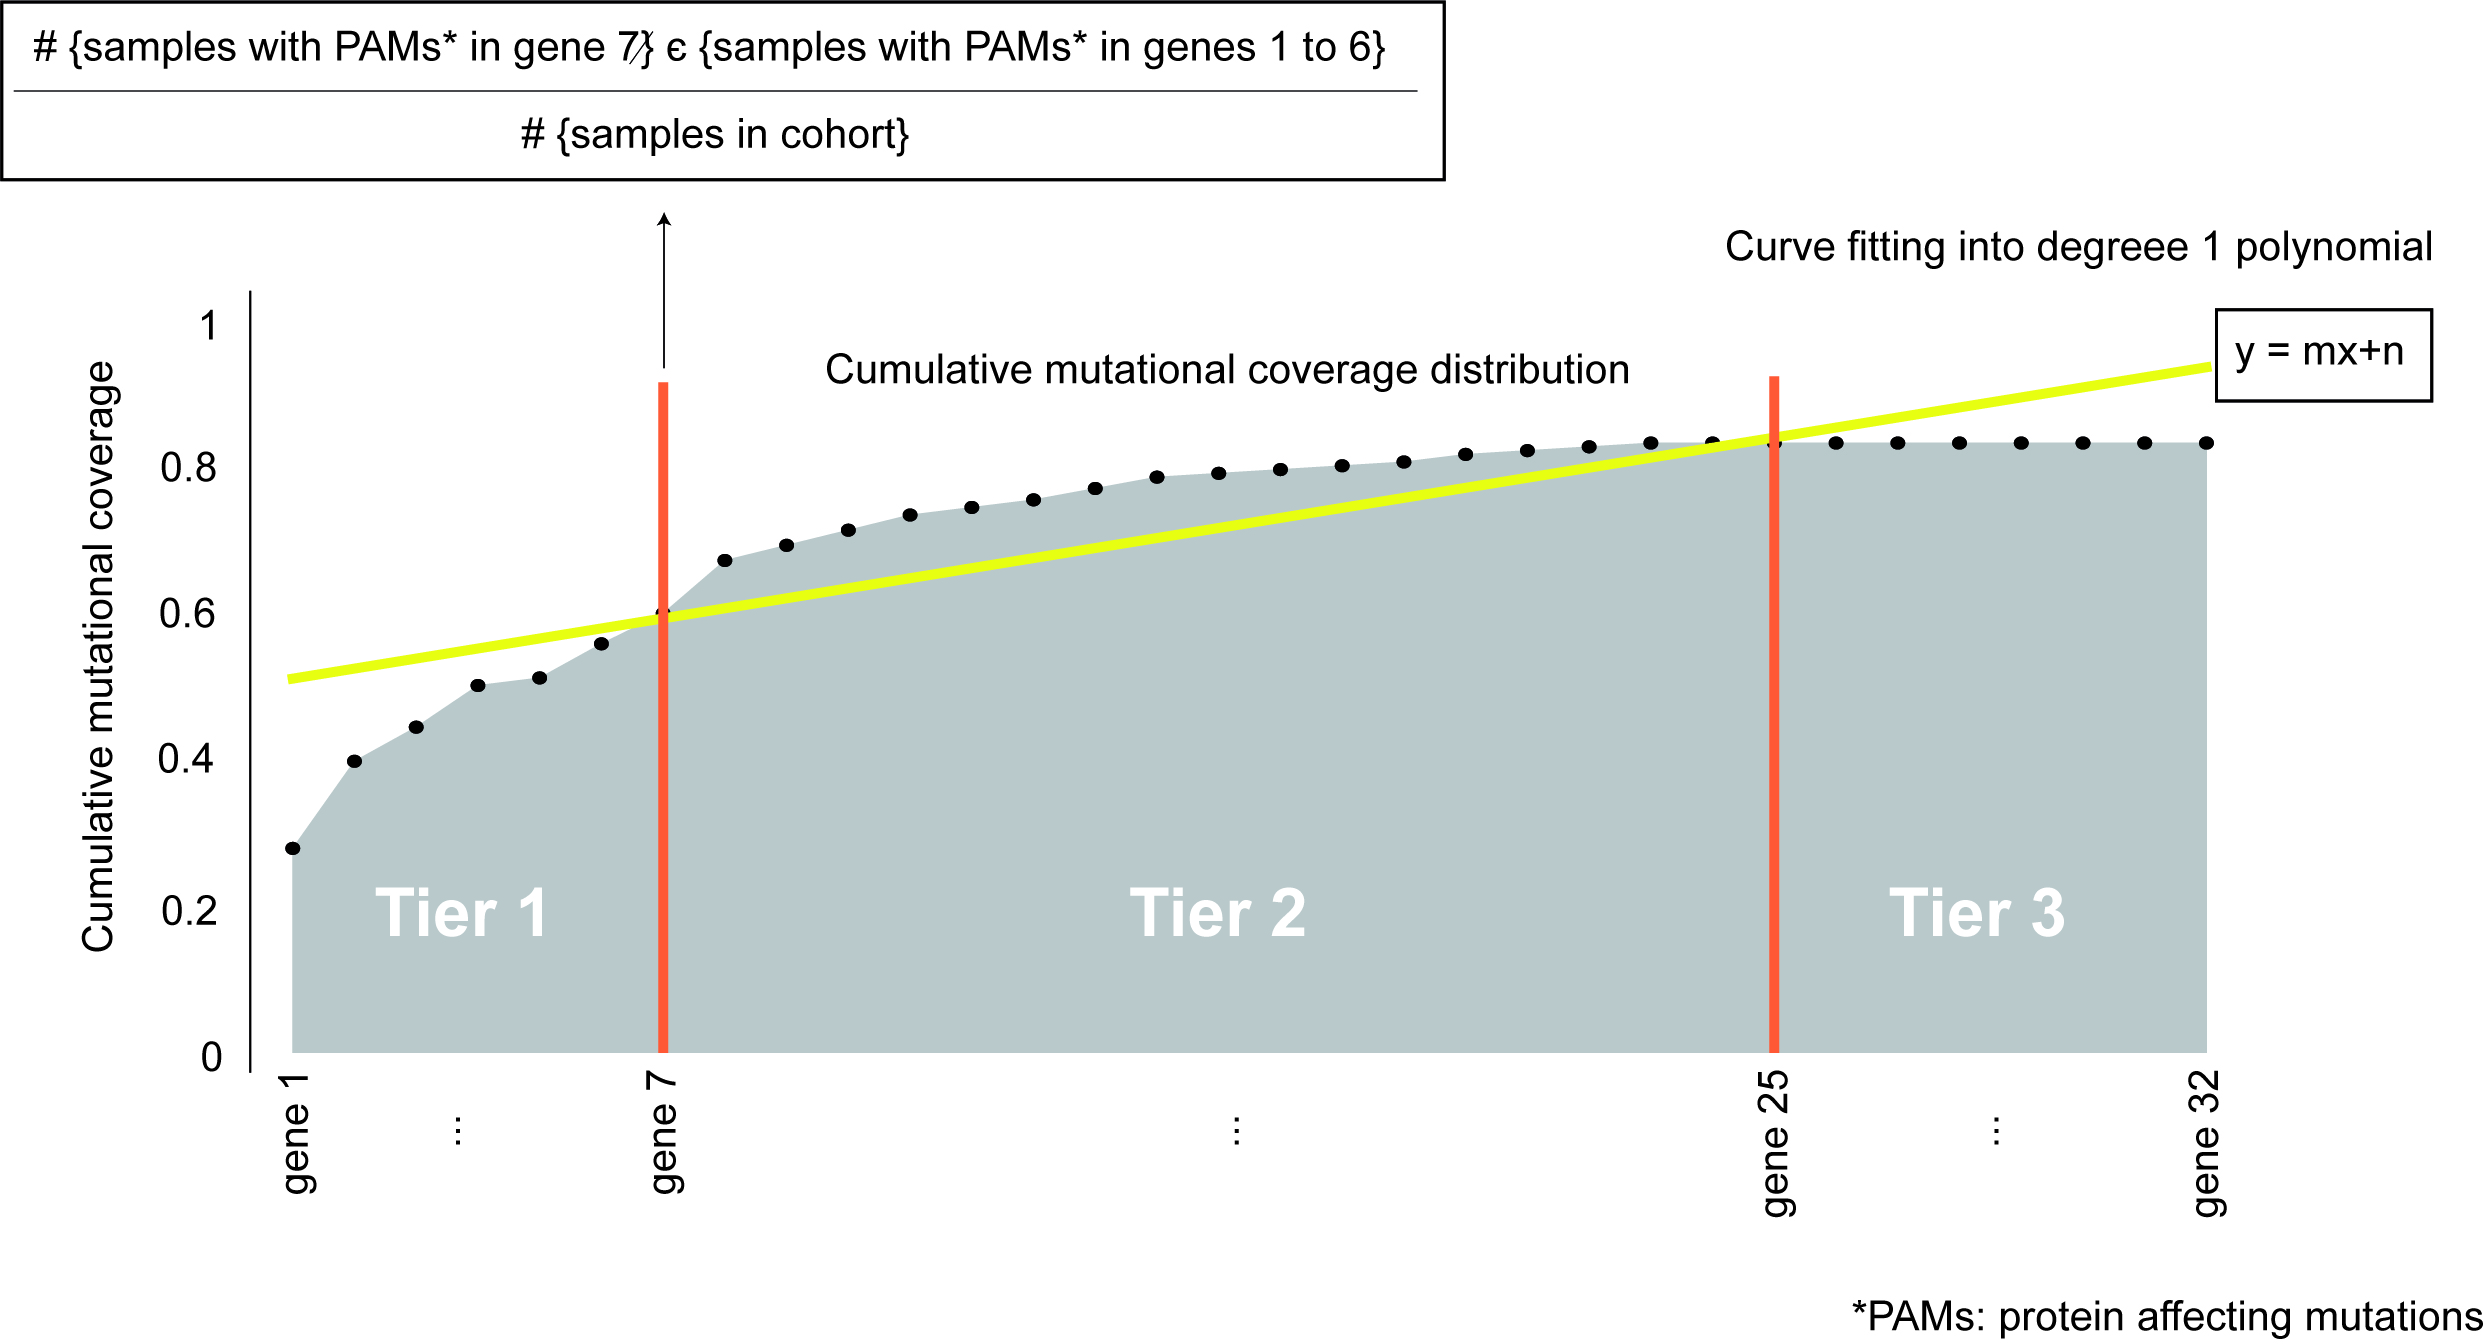
To prioritize and sort the genes in the panel (either from one of the pre-compiled lists or inputted by the researcher) we computed the cumulative fraction of tumors in the cohort with mutations in each of the genes. We refer to this cumulative distribution as the cumulative mutational coverage of the cohort by the panel. The contribution of each gene to this cumulative mutational coverage is computed as the fraction of tumors with mutations in the gene over all previous genes in the sorting. We then fitted the cumulative mutational coverage to a degree 1 polynomial to select the set of genes that contribute the most to this cumulative mutational coverage.
The set of genes which contribute the most to the cumulative mutational coverage (Tier 1) are those between the beginning of the distribution and the first intersection of the cumulative distribution and its linear fit (genes 1 to 7 in the figure). Genes between the first and second points of intersection between the cumulative distribution and the linear fit are considered Tier 2 (genes 8 to 25 in the figure). All other genes in the starting list, which do not contribute to the cumulative mutational coverage are termed Tier 3 and are not included in the designed panel (genes 26 to 32 in the figure).
Tier 1 genes can be fine tuned by being more restrictive in the inclusion of genes in Tier 1, named Tier 1 stringent classification. This starts from the aforementioned classification of genes in tiers and applies the same rationale of gene prioritization through intersection of the cumulative distribution with its linear fit but based only on Tier 1 cumulative distribution. Thus, amongst Tier 1 genes it prioritizes the ones increasing more the mutational coverage, the genes between the beginning of the distribution and last intersection of the Tier 1 genes cumulative distribution, the genes after it are re-allocated as Tier 2 genes.
The distribution of the mutations along the sequence of cancer driver genes can be heterogeneous. In other words, for particular genes mutations tend to accumulate in certain gene regions (e.g. protein regulatory sites in oncogenes). Hence, identifying highly mutated gene hotspots would improve the cost-effectiveness of the panel. We identified hotspots with high density of mutation running windows of variable sizes along gene sequences and iteratively identifying windows accumulating mutations over their distribution in the driver protein. (See Supplementary Methods of the OncoPaD manuscript for more details on this point.)
To provide the designer of the panel ancillary information on relevant mutations associated to tumorigenesis or response to anti-cancer drugs we have retrieved information from the following sources:
- A list of validated oncogenic mutations, obtained from the catalog of driver mutations of Tamborero et al. (in preparation, data available here), which contains somatic and germline mutations whose role in oncogenesis has been experimentally validated in different cancer types.
- A list of mutations known to predict sensitivity or resistance to anti-cancer drugs, obtained from the Cancer bioMarkers database by Tamborero et al. (in preparation, data available here), which contains expert curated annotations of genomics biomarkers associated to a drug effect on tumors, either drug “response” or “resistance.”