Exploring multiple cancer genomics alterations with Gitools.

Cancer genomics data that is produced creates multi-dimensional data sets. Gitools lets you browse all that data at once.
A typical cancer genomics project nowadays screens the cancer genome, epigenome and transcriptome of a cohort of patients and identifies various types of alterations: Copy Number changes, Somatic Mutations, Gene Expression changes and others. This is the case of projects framed within The Cancer Genome Atlas or the International Cancer Genomics Consortium, as well as many others. Each of these types of alterations is represented in different data formats and it remains a challenge to integrate them to get a unified view of the process of alterations that leads to tumorigenesis. In Gitools it is possible to explore and analyze multi-value matrices in the form of interactive heatmaps, making it possible to work with various data dimensions at once. The interactivity of heatmaps in Gitools aids in the exploration of those large multi-dimensional data sets effectively, and the thoroughly customizable visualization options allow to display each alteration type in the most convenient way.

Rows and columns can be annotated by colors and text. In this example the columns are annotated by vital status and Glioblastoma subtype (top-down) and the rows are annotated by gene symbol, chromosome and band (left-right).
One of the advantages of having different dimensions in the same heatmap, like for example Copy Number Alterations (CNA) and Expression in the same file, is that after filtering or sorting on one dimension (e.g. CNA) it is possible to observe the effect of this filtering or sorting on another (gene expression changes). Another additional layer of information in cancer genomics data is the clinical features related to the donors of the tumor samples (eg. tumor subtype, age, sex). Similarly, genes may also be linked to various sets of annotations (eg. chromosomal location, pathway), and it is very useful to visualize those annotations along with the heatmap. In Gitools a multitude of annotations can be added in the form of text or color bars (see image in the right). We are preparing documentation in the Gitools help site to better describe these capabilities of the program. Take a look at the section “How to Browse Multi-dimensional data”. We are also preparing a new Case Study (Studying multi-dimensional cancer data with Gitools) with some video tutorials. The first one in this series (embedded below) shows how you can browse multi-dimensional data.
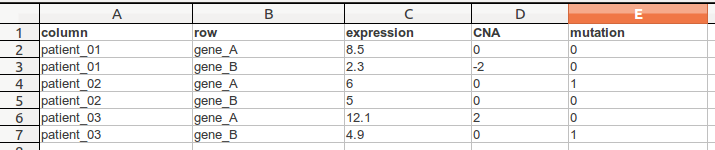
TDM file format is a tab delimited file that has contains multiple values per row (eg. gene) and column (eg. sample). The first line is a header line following a line for each cell. In this following example we see a .tdm-file that contains three columns and two rows.